As an education decision maker, I wantto be able to analyze indicator datafrom the data warehouse in tables,graphs and maps.
Introduction
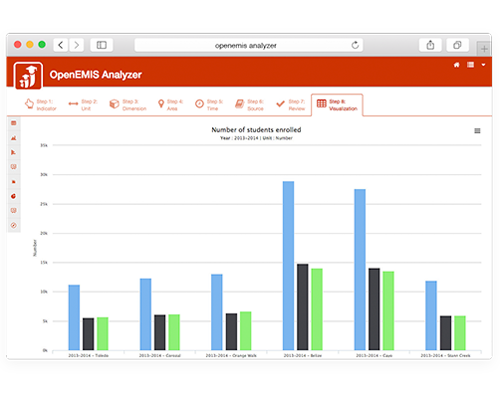
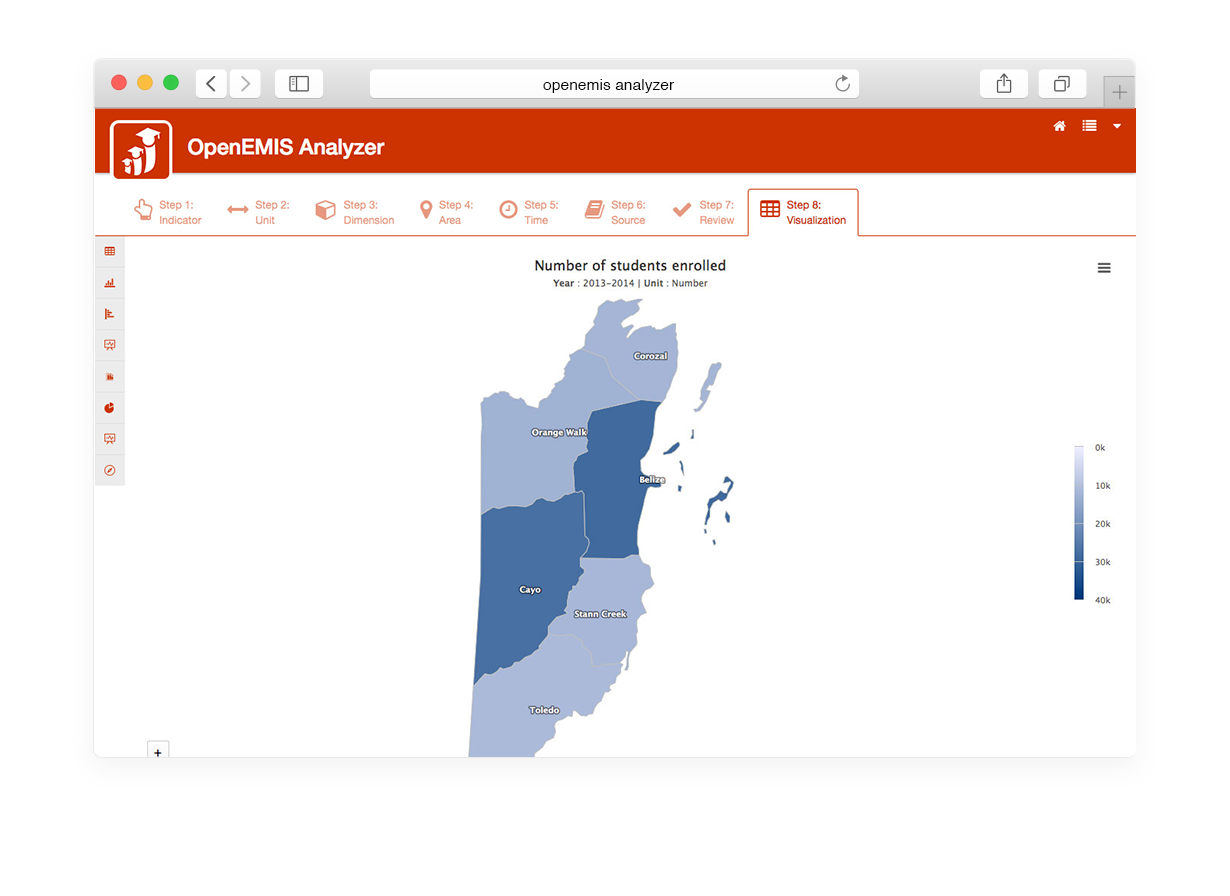
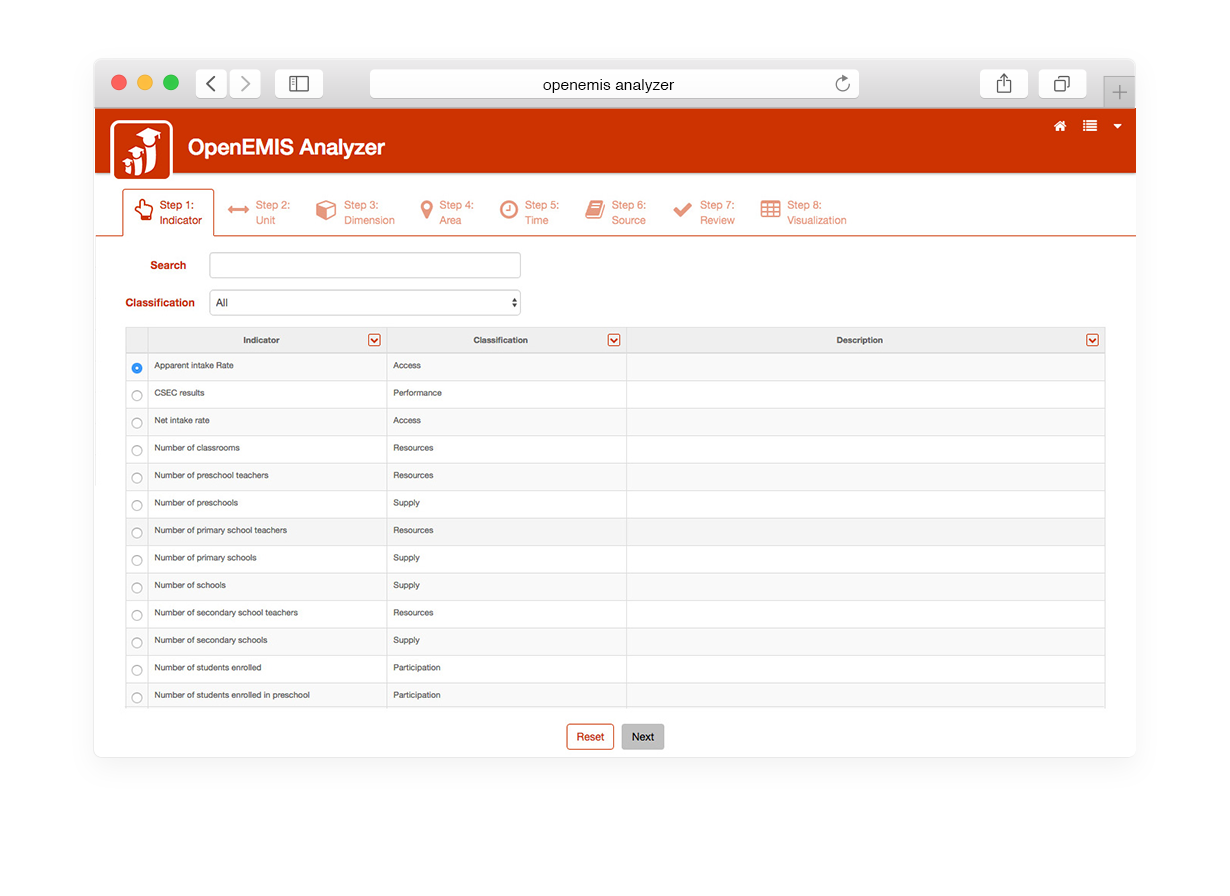
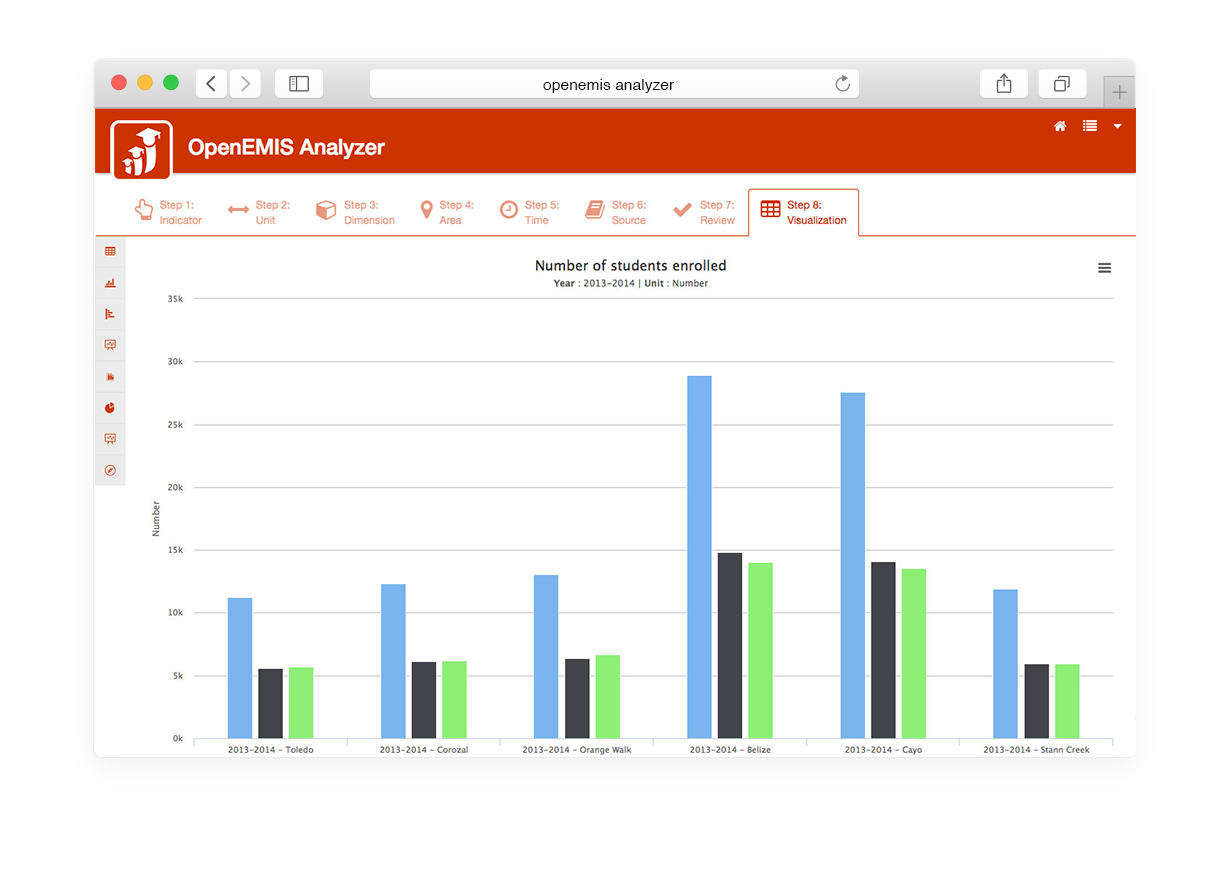
OpenEMIS Analyzer is a web based application for analyzing and visualizing indicator-baseddata by area, time period, and source in tables, graphs, and maps. OpenEMIS Analyzer hasa user-friendly interface that allows decision makers, education planners, field workers, NGO’s,and researchers to easily analyze data. With OpenEMIS Analyzer the user can save and sharevisualization objects that can be easily integrated to presentations, brochures, and/or othermaterials. OpenEMIS Analyzer turns raw data into usable information.
As an education decision maker, I want to be able to analyze indicator data from the data warehouse in tables, graphs and maps.Click on icon to download
Introduction
OpenEMIS Analyzer is a web based application for analyzing and visualizing indicator-based data by area, time period, and source in tables, graphs, and maps. OpenEMIS Analyzer has a user-friendly interface that allows decision makers, education planners, field workers, NGO’s, and researchers to easily analyze data. With OpenEMIS Analyzer the user can save and share visualization objects that can be easily integrated to presentations, brochures, and/or other materials. OpenEMIS Analyzer turns raw data into usable information.