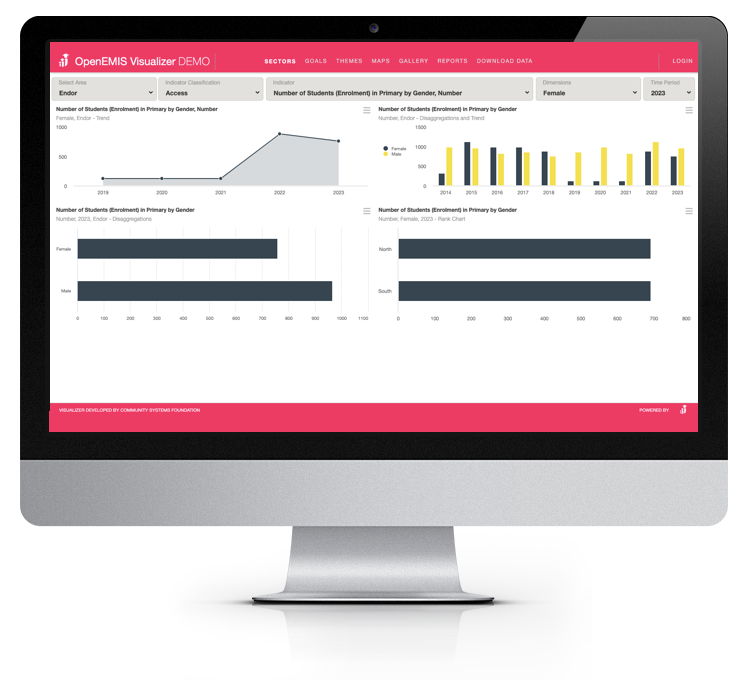
Visualize education data, identify patterns, trends, and outliers in data.
As an education decision maker, I want to be able to share indicator data in tables, graphs and maps in a visual format.
Introduction
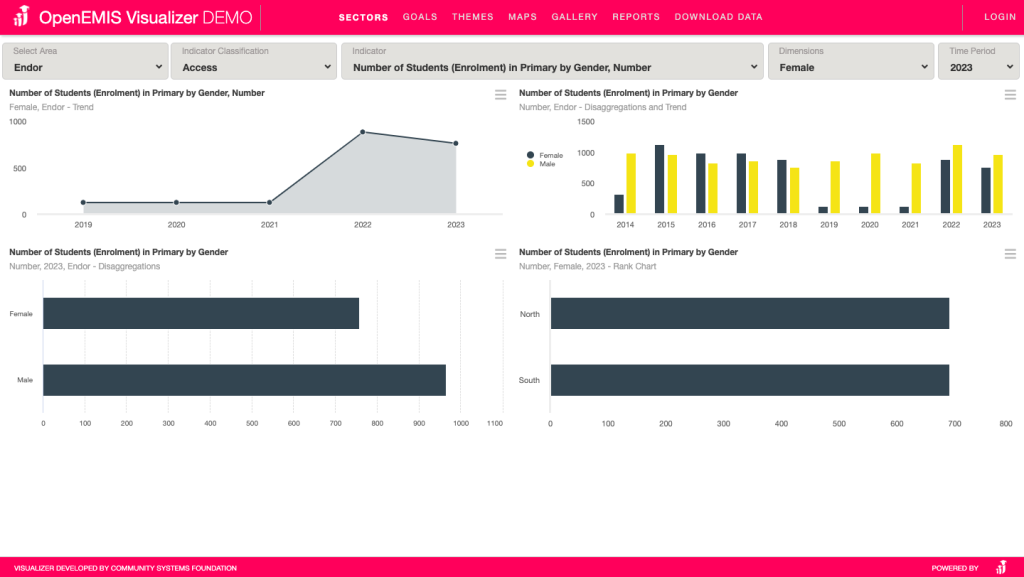
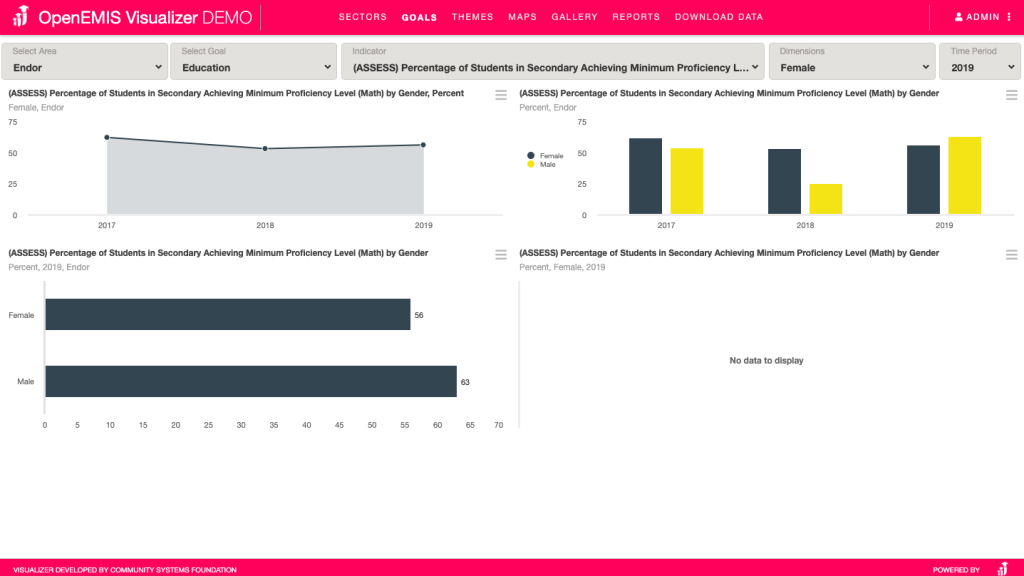
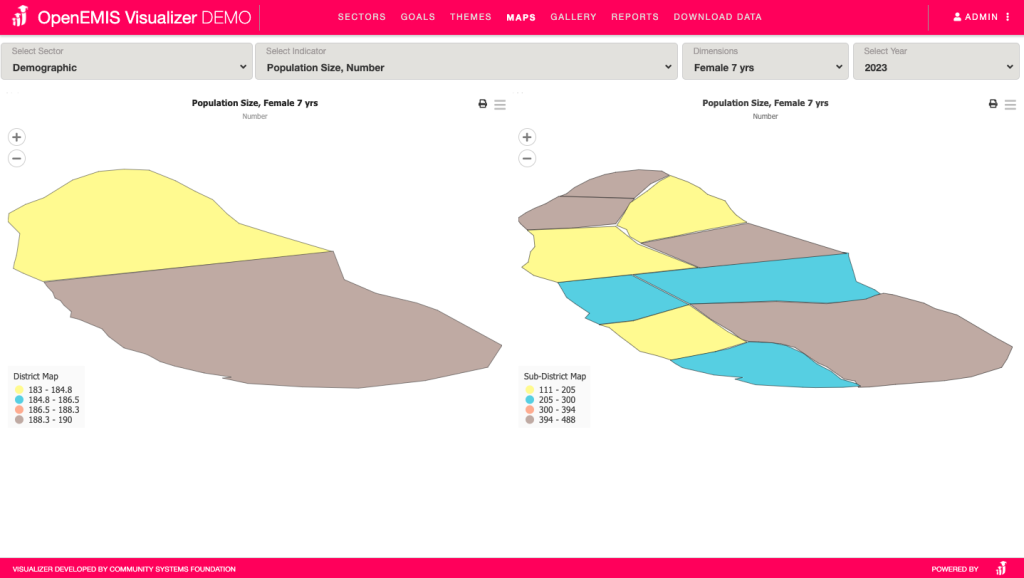
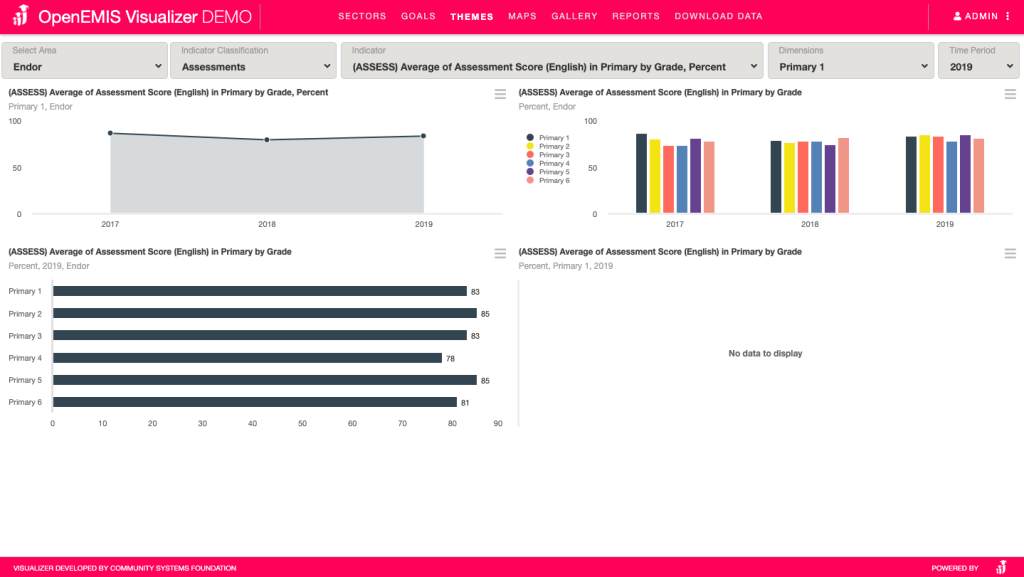
OpenEMIS Visualizer enables the user to analyze and visualize indicator-based data by area, time period, and source in tables, graphs, and maps. OpenEMIS Visualizer has a user friendly interface that allows decision makers, education planners, field workers NGO’s, and researchers to easily analyze data. With OpenEMIS Visualizer the user can save and share visualization objects that can be easily integrated to presentations, brochures and/or other materials. OpenEMIS Visualizer turns raw data into usable information.